R/topic-ln.R
ln.Rd
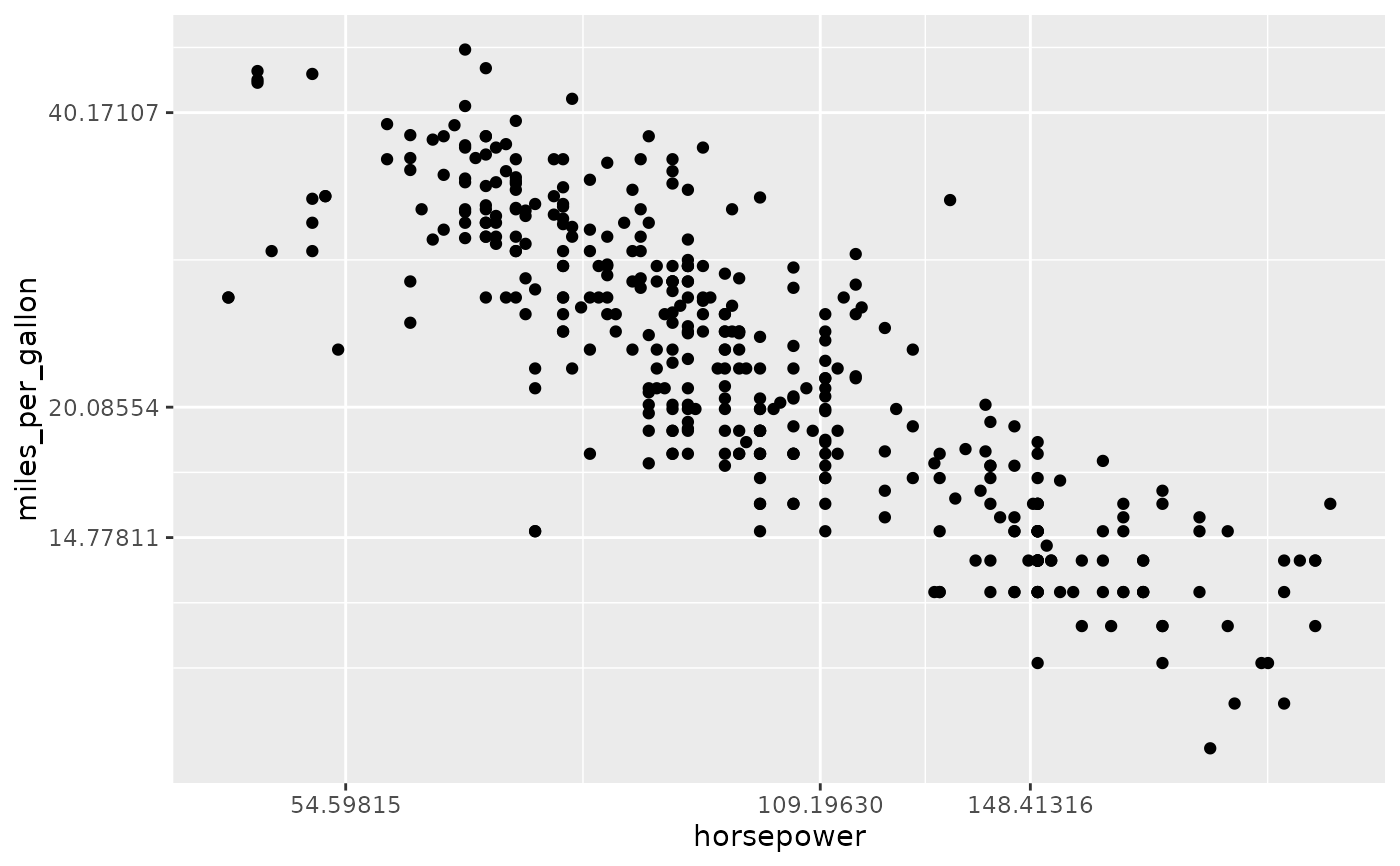
The ln scale maps data values to a visual property through a natural logarithm transformation.
ln
The name of an aesthetic to scale (required).
library(duckdb)
con <- dbConnect(duckdb())
dbWriteTable(con, "cars", cars)

dbGetPlot(con, "
  visualize
    horsepower as x,
    miles_per_gallon as y
  from cars
  using points
  scale by
    ln(x),
    ln(y)
")