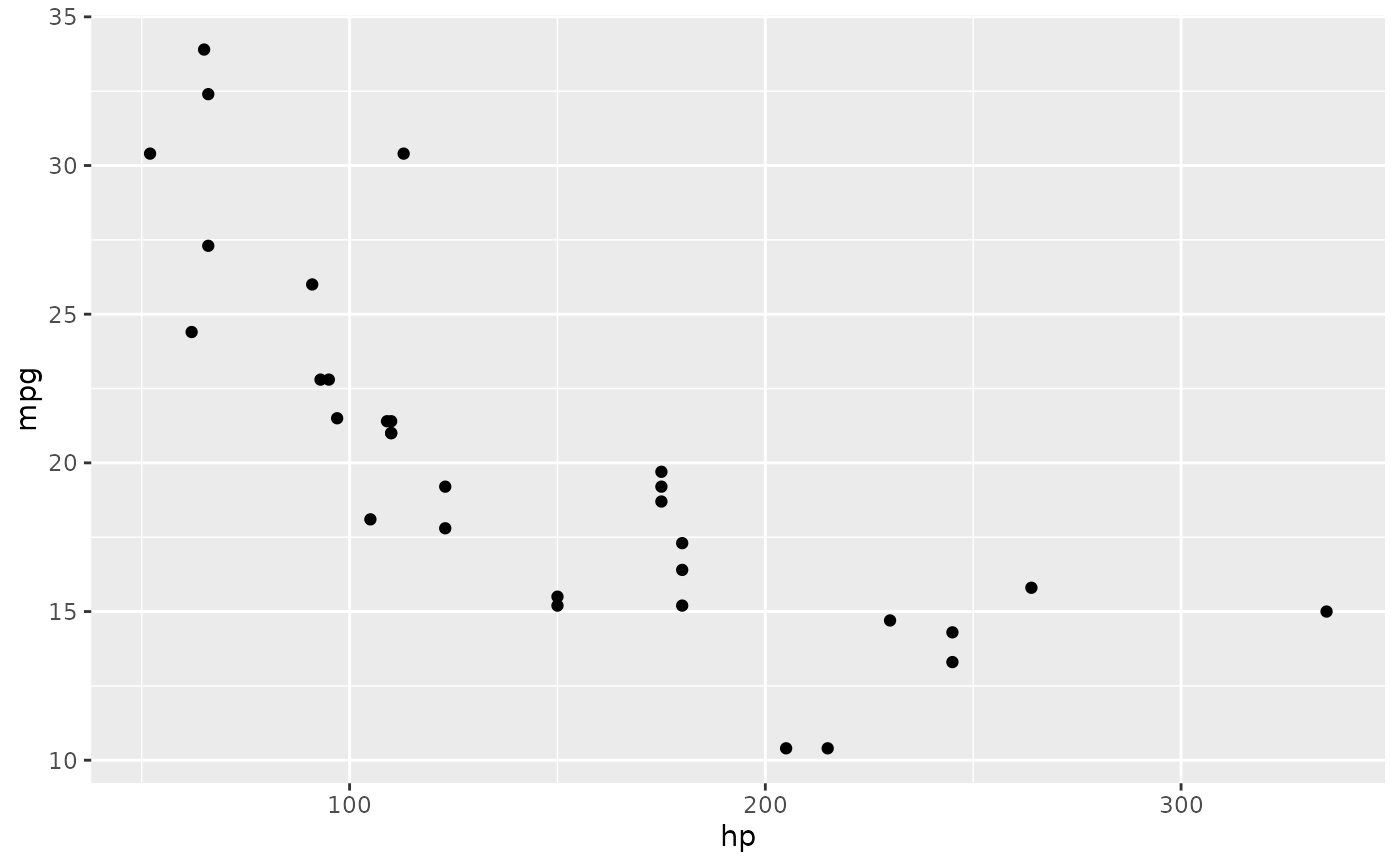
Skip to contents

dbGetPlot takes a DuckDB connection and a SGL statement and returns the plot defined by the SGL statement.

Usage

dbGetPlot(con, sgl_stmt)

Arguments

con

A DuckDB connection created with DBI::dbConnect()

sgl_stmt

A SGL statement string that defines the plot

Value

A ggplot2 plot object

Details

The SGL statement is parsed into an internal graphics structure, the referenced data is queried from DuckDB, semantic validation is performed, any column-level transformations and aggregations are applied, and the result is converted to a ggplot2 plot object.

SGL statements support the following clauses: visualize (aesthetic mappings), from (data source or SQL subquery), using (geom type), group by, collect by, scale by, facet by, title, and the layer operator for combining multiple layers.

See also

vignette("sgl-language-guide") for the full SGL syntax reference.

Examples

library(duckdb)
#> Loading required package: DBI
con <- dbConnect(duckdb())
dbWriteTable(con, "cars", mtcars)

# Scatterplot
dbGetPlot(con, "
  visualize
    hp as x,
    mpg as y
  from cars
  using points
")


# Histogram
dbGetPlot(con, "
  visualize
    bin(mpg) as x,
    count(*) as y
  from cars
  group by
    bin(mpg)
  using bars
")


# Scatterplot with regression line overlay
dbGetPlot(con, "
  visualize
    hp as x,
    mpg as y
  from cars
  using (
    points
    layer
    regression line
  )
")