Documents the aliases, aesthetics, and qualifiers for the line geom.
Qualifiers
horizontal: orients the line horizontally; points are connected in order of increasingx/thetavalues.regression: fits a linear regression line to the data.vertical: orients the line vertically; points are connected in order of increasingy/rvalues.
Examples
library(duckdb)
con <- dbConnect(duckdb())
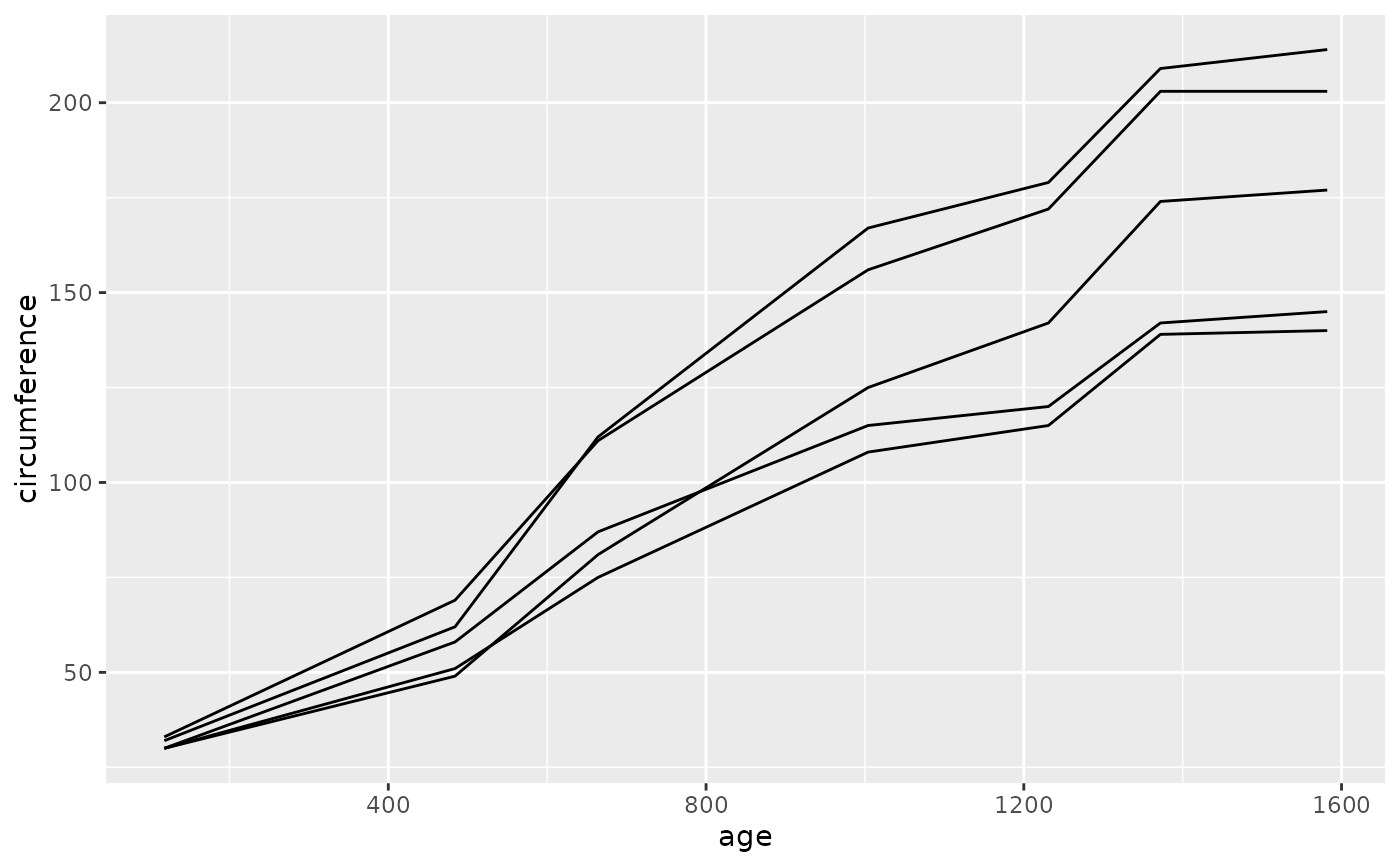
dbWriteTable(con, "trees", trees)
dbGetPlot(con, "
visualize
age as x,
circumference as y
from trees
collect by
tree_id
using lines
")
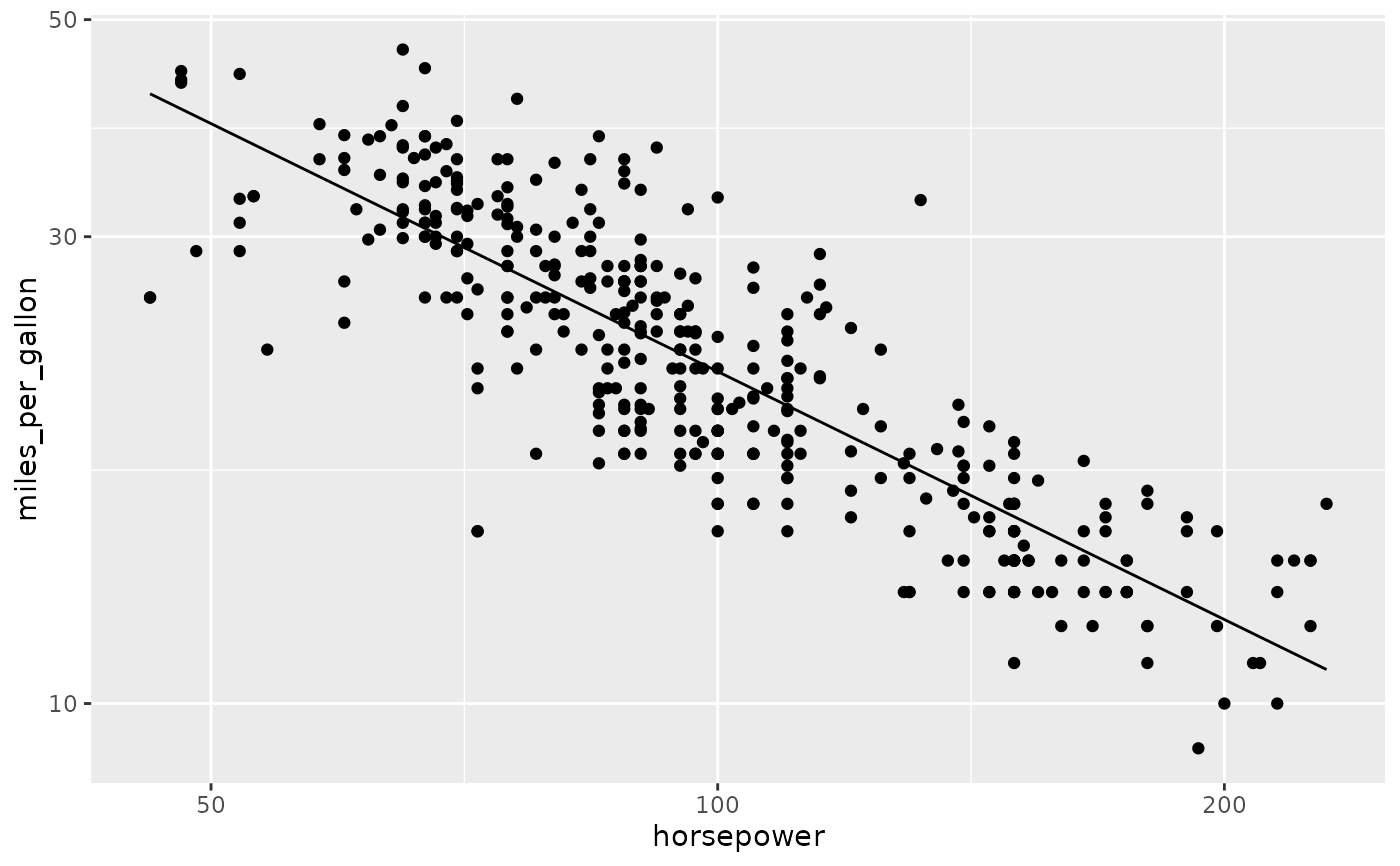
 dbWriteTable(con, "cars", cars)
dbGetPlot(con, "
visualize
horsepower as x,
miles_per_gallon as y
from cars
using (
points
layer
regression line
)
scale by
log(x),
log(y)
")
dbWriteTable(con, "cars", cars)
dbGetPlot(con, "
visualize
horsepower as x,
miles_per_gallon as y
from cars
using (
points
layer
regression line
)
scale by
log(x),
log(y)
")