The linear scale linearly maps data values to a visual property.
It is the default scale for numerical aesthetic mappings.
Examples
library(duckdb)
con <- dbConnect(duckdb())
#> duckdb keeps downloaded extensions and secrets in a temporary directory:
#> ℹ /tmp/RtmpMm0YzW/duckdb
#> This is removed when the R session ends.
#> • Extensions are re-downloaded each session.
#> • Secrets are lost.
#> ℹ Run duckdb(shared_home = TRUE) (or create ~/.duckdb) to keep them (suitable for most users).
#> ℹ Run duckdb(shared_home = FALSE) to accept the temporary directory (and silence this message).
#> ℹ See ?duckdb_storage for details and alternatives.
dbWriteTable(con, "cars", cars)
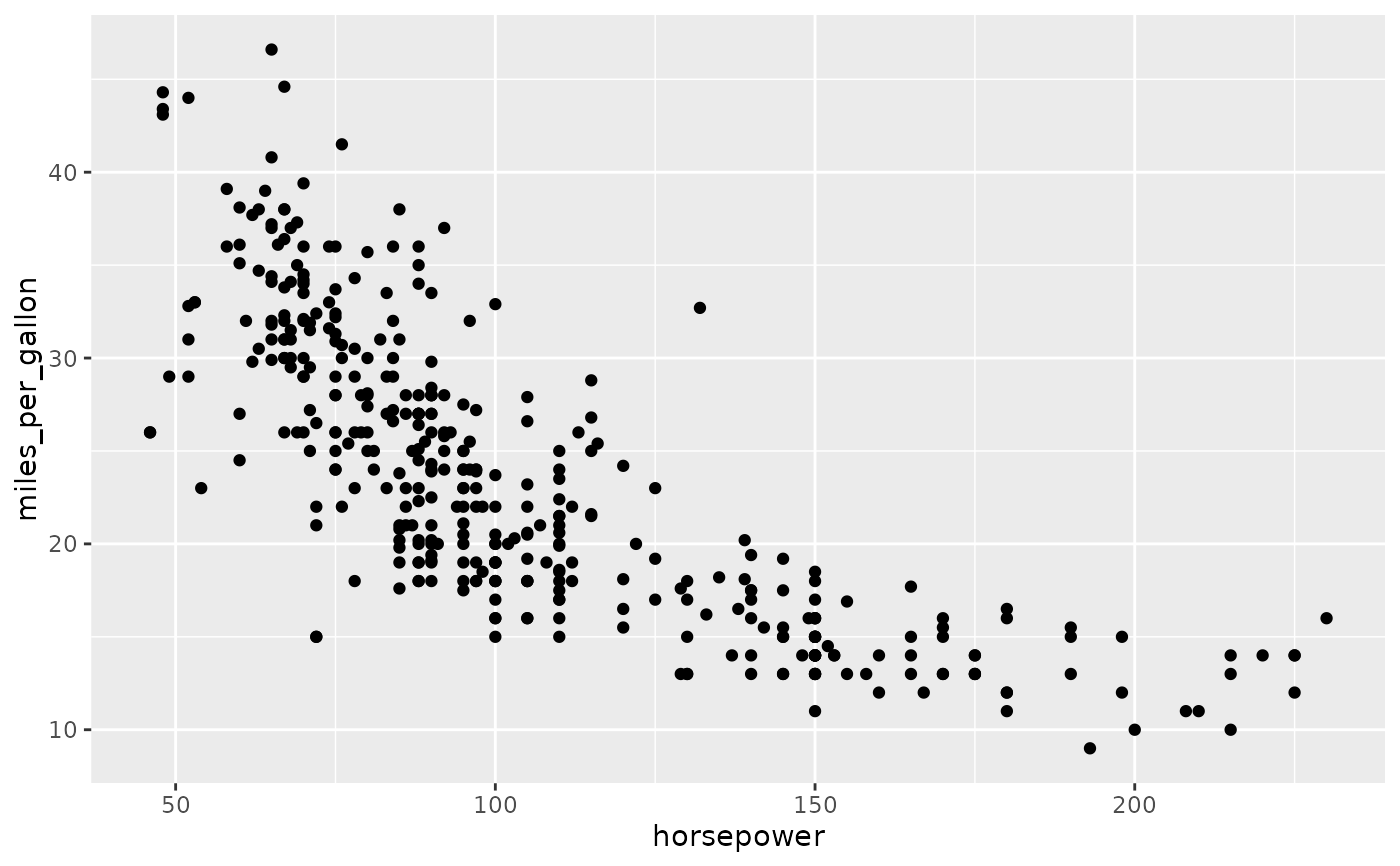
# explicit linear scales
dbGetPlot(con, "
visualize
horsepower as x,
miles_per_gallon as y
from cars
using points
scale by
linear(x),
linear(y)
")
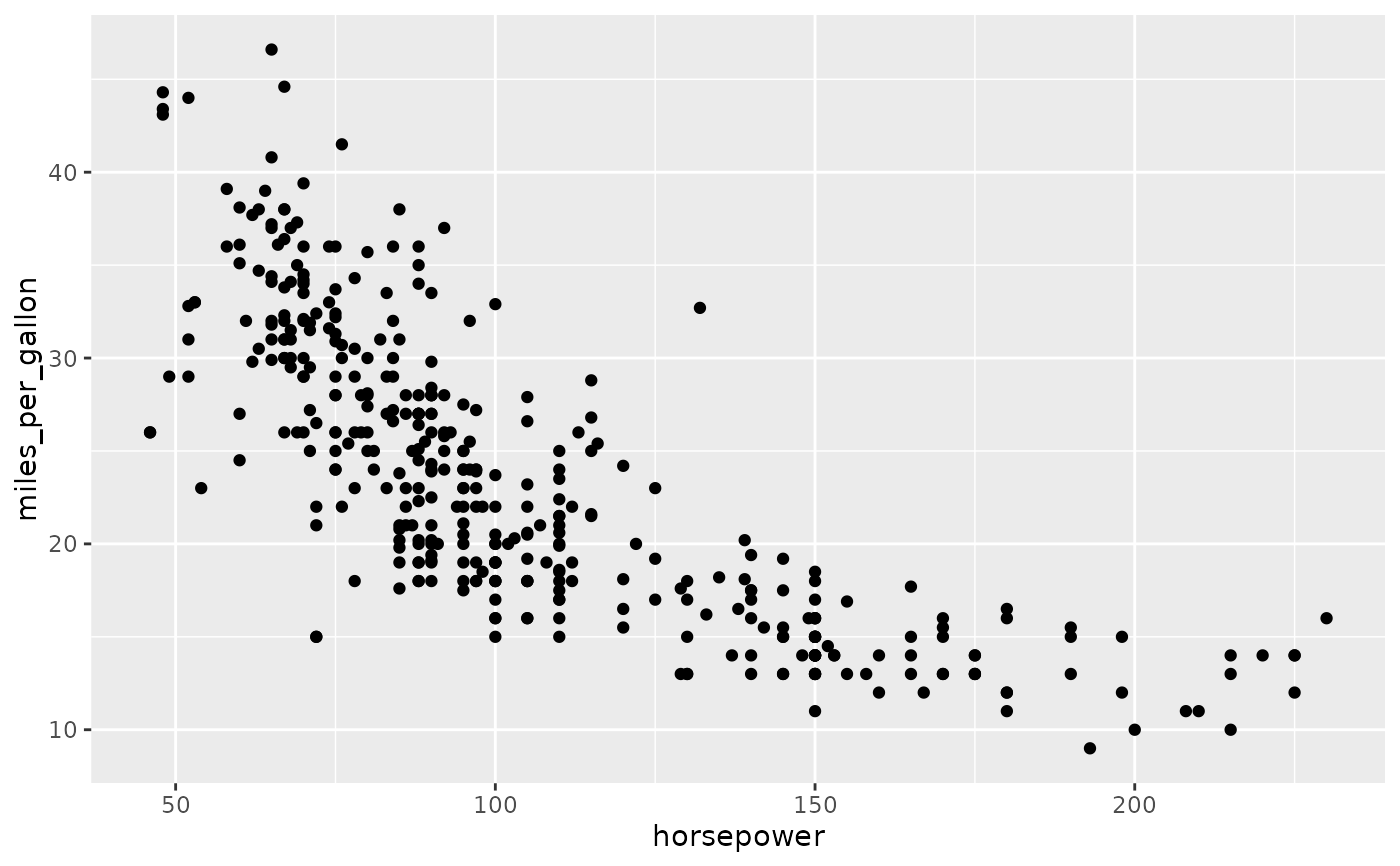 # default linear scales
dbGetPlot(con, "
visualize
horsepower as x,
miles_per_gallon as y
from cars
using points
")
# default linear scales
dbGetPlot(con, "
visualize
horsepower as x,
miles_per_gallon as y
from cars
using points
")